Economics, Concentration in Statistics · Grinnell College, Class of 2029
37 counties modeled4,234 earnings announcements
I study economics at Grinnell and spend most of my time with data that needs cleaning before it can say anything. My research so far has looked at why health outcomes differ across reservation counties and how stock prices react when companies barely beat or barely miss earnings expectations.
I grew up in Fredericksburg, Texas, where I ran the city pool as Head Lifeguard for four summers. At Grinnell I sprint for the NCAA track and field team. I am looking for a Summer 2027 internship in economic research, data analysis, or finance.
Stock reactions at the zero-surprise threshold In progressFall 2026
Applied Econometrics, Grinnell College · with a classmate
Regression discontinuity · Stata · Bloomberg
Do markets treat a company that beats analyst expectations by a cent differently from one that misses by a cent? Using 4,234 S&P 100 earnings announcements from 2015 to 2025, pulled from a Bloomberg terminal, we line each announcement up with the right trading days, compute returns relative to the market, and use a regression discontinuity design at zero surprise. Early work shows reported earnings bunching just above zero, which is itself part of the story.
Geography as a Healthcare Barrier: How Isolation and Underfunding Drive Health InequalitySpring 2026
Health Economics, Grinnell College · with Jess Christensen · supervised by Prof. Hall
Regression analysis · R · ggplot2
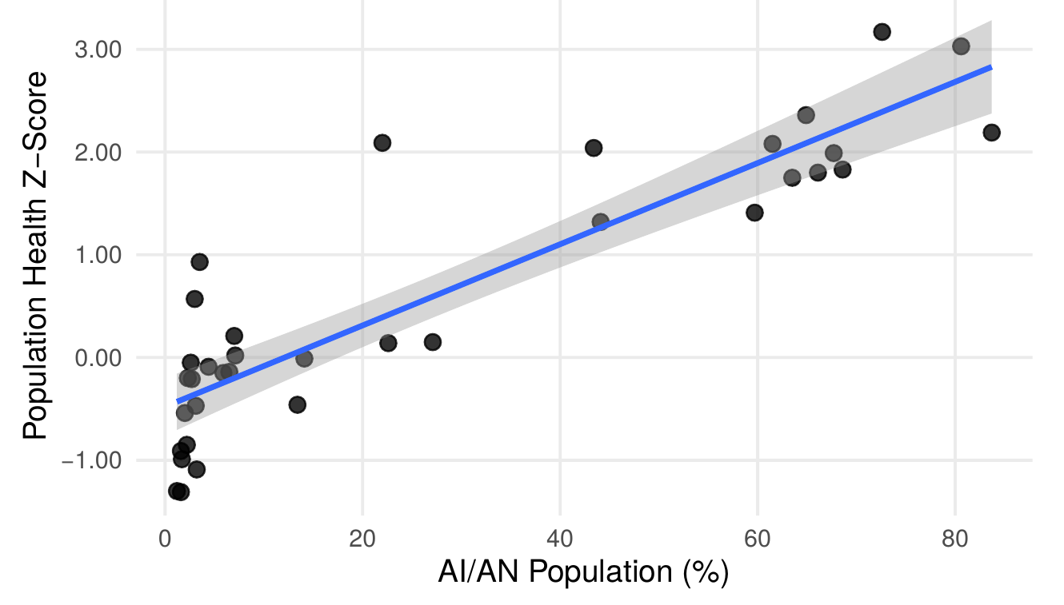
Why do Native Americans living on reservations have worse health outcomes? We combined county-level health, poverty, and rural data for 37 counties and built four regression models and a t-test to test three barriers: geographic isolation, Indian Health Service underfunding, and poverty. The share of a county's population that is American Indian or Alaska Native explains about 79% of the variation in health scores on its own. Poverty is a key part of the mechanism, and once poverty and population share are in the model, rurality adds almost nothing, which changes where policy attention should go.
Each point is a county (n = 35). Higher z-scores mean worse health outcomes. Line is the OLS fit with a 95% confidence band; slope 0.040 per percentage point, R² = 0.79.